

Congenital Cardiac Anesthesia Society
A Section of the Society for Pediatric Anesthesia.

ECHO Question of the Month – October 2026 – Keyword: Fontan Fenestration, Transesophageal Echocardiography (TEE)

October 2026 ECHO Question of the Month Authors:

Matthew Boisvert, MD
Advanced Pediatric Cardiac Anesthesiology Fellow
Division of Cardiac Anesthesiology
Department of Anesthesiology and Critical Care Medicine
Children’s Hospital of Philadelphia, Philadelphia, PA

Asif Padiyath, MBBS
Attending Physician-Cardiac Anesthesiology and Cardiology (Imaging)
Division of Cardiac Anesthesiology
Department of Anesthesiology and Critical Care Medicine
Children’s Hospital of Philadelphia, Philadelphia, PA
Assistant Professor, Anesthesiology and Critical Care
Perelman School of Medicine at the University of Pennsylvania

A 15-year-old female with tricuspid atresia and a history of staged single-ventricle palliation culminating in extracardiac fenestrated Fontan presented for posterior spinal fusion surgery for idiopathic scoliosis.

Preoperative oxygen saturation was 90%. The most recent transthoracic echocardiogram demonstrated low-normal left ventricular systolic function, trivial mitral valve regurgitation, and a patent Fontan fenestration.

After uneventful induction of general anesthesia, transesophageal echocardiography (TEE) was performed for assessment of ventricular function and to monitor volume status during the procedure. Color-flow Doppler interrogation of the Fontan pathway demonstrated flow across the Fontan fenestration into the common atrium.

Question 1

What structures and flow pattern are demonstrated in Video 1 and 2?

Answer

Video 1 demonstrates a mid-esophageal four chamber view showing 2D assessment of the Fontan pathway, ventricular function, and mitral valve. Video 2 shows a patent Fontan fenestration, on Color flow doppler with continuous flow throughout the cardiac cycle. The fenestration provides communication between the Fontan pathway and the common atrium (i.e., the atrium loading the sub-systemic ventricle).

Question 2

What is the physiologic purpose of a Fontan fenestration?

Answer

A fenestration functions as a controlled right-to-left shunt. Because blood flow through the Fontan circulation occurs without a subpulmonary ventricle, pulmonary blood flow depends on the pressure gradient between the systemic venous pathway and the common atrium, otherwise known as the transpulmonary gradient. Figure 1 below is a schematic that demonstrates Fontan physiology further.

The fenestration provides a "pop-off" pathway to provide preload into the common atrium when pulmonary vascular resistance rises, and systemic venous drainage via the Fontan pathway is impaired. This can augment ventricular preload and cardiac output at the expense of systemic arterial oxygen saturation.
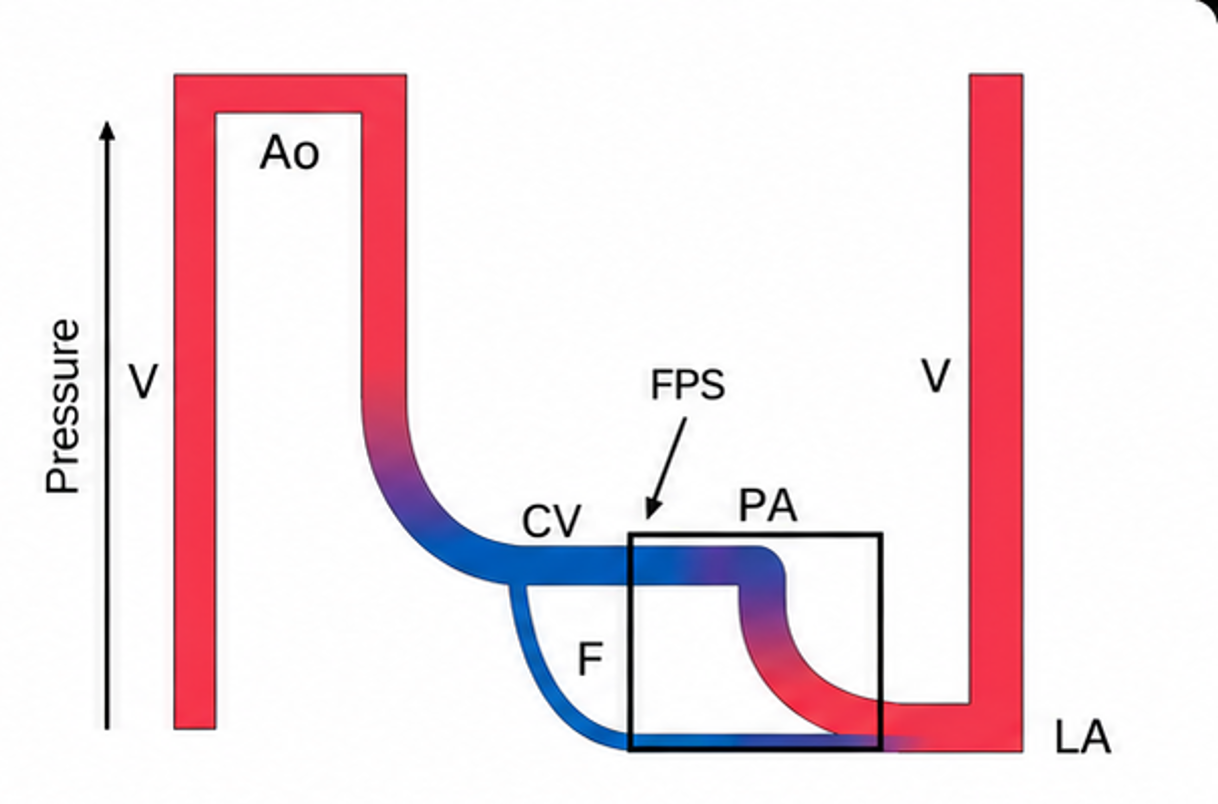
Figure 1:  Schematic representation of the flow/pressure/saturation of a modern Fontan circuit . Line thickness reflects output, height reflects pressure and color reflects oxygen saturation. The Fontan portal system (FPS) is demonstrated by black rectangle. Ao, aorta; CV, caval veins; F, fenestration; LA, left atrium; PA, pulmonary artery; V, single ventricle (Image generated by OpenAI, ChatGPT-5.6Sol, 2026. Adapted from Gewillig, 2019)

From the echocardiographer's perspective, identification of a patent fenestration is therefore not simply an anatomic observation. The direction and velocity of flow across the fenestration provide information about the pressure relationship between the Fontan pathway and the common atrium. (Figure 2)
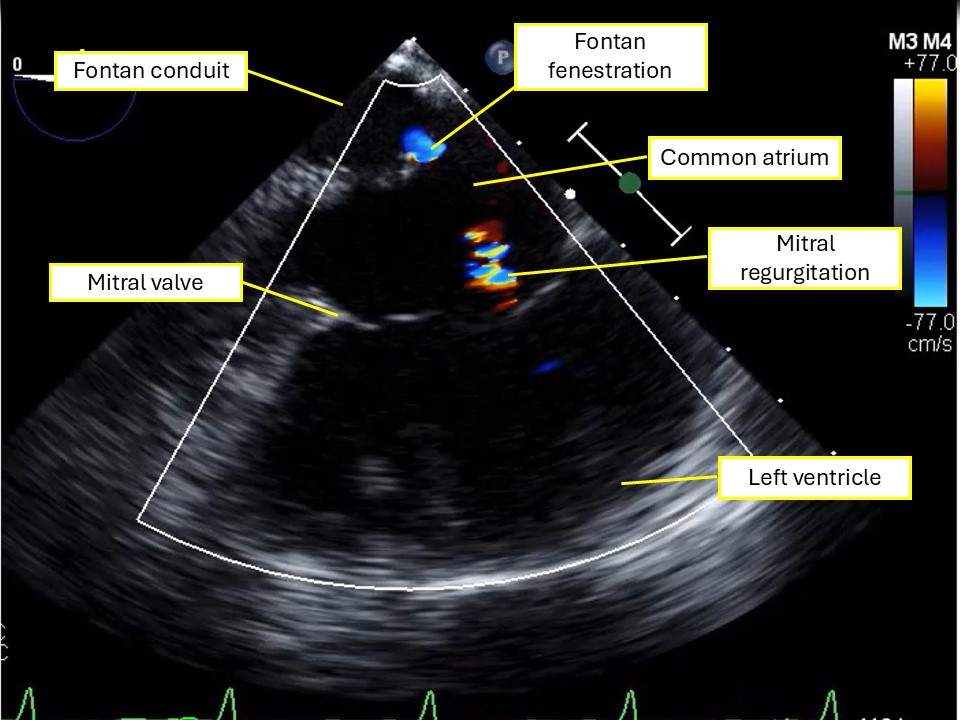
Figure 2: Midesophageal four chamber view with color flow doppler. Structures are labeled.

Question 3

How should the pressure gradient across a Fontan fenestration be assessed with TEE?

Answer

After identifying the fenestration with 2D and color-flow Doppler a in midesophageal four chamber view, spectral Doppler is used to assess flow across the communication (Figure 3). The Doppler beam should be aligned as parallel as possible to fenestration flow. Depending on the anatomy and type of Fontan connection, multiplane imaging and probe manipulation may be required to optimize Doppler alignment.
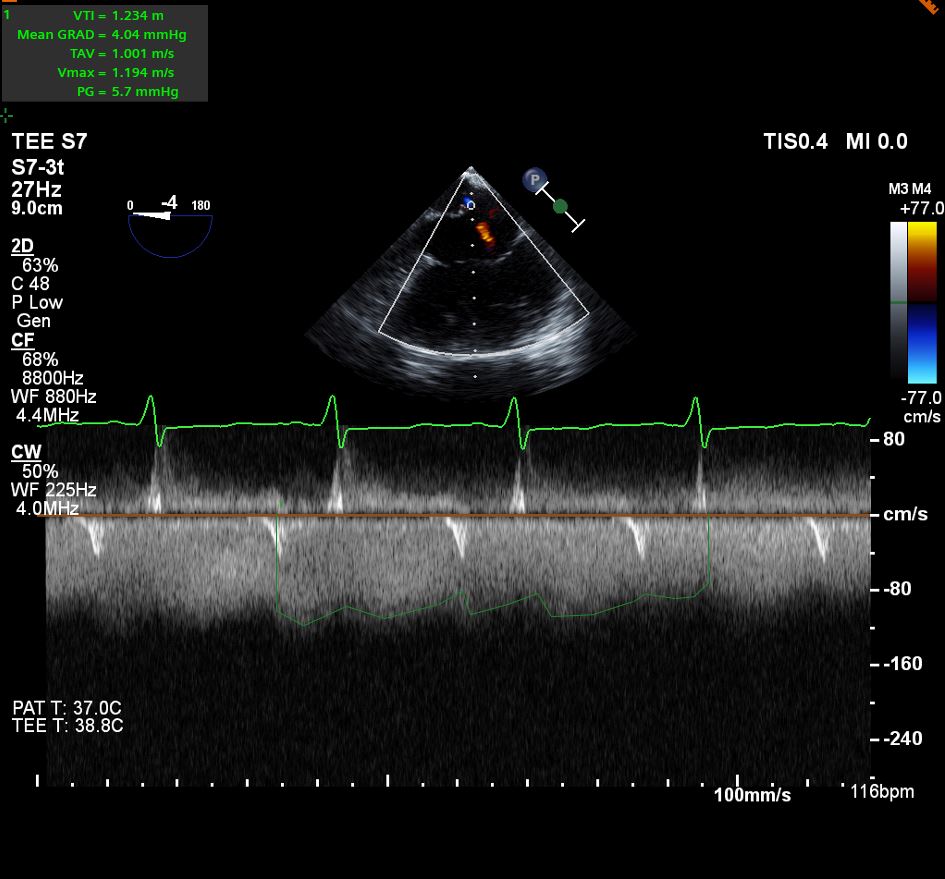
Figure 3: Midesophageal 4 chamber view with color flow and spectral doppler to assess the flow and gradient through the Fontan fenestration.

Continuous-wave Doppler can be used to obtain the spectral Doppler envelope across the fenestration. Although the peak instantaneous gradient can be derived from the maximal velocity using the simplified Bernoulli equation (ΔP = 4V²), the mean Doppler gradient across the fenestration is the clinically relevant measurement for estimating the pressure difference between the Fontan pathway and the common atrium. The mean gradient is calculated from velocities throughout the Doppler envelope rather than from the single peak velocity.

Question 4

If the mean Doppler gradient across the Fontan fenestration is 4 mmHg, what does this gradient represent physiologically?

Answer

The mean fenestration gradient represents the pressure difference between the Fontan pathway and the common atrium over the period of measured flow.

When flow is directed from the Fontan pathway toward the common atrium:

Mean fenestration gradient ≈ mean Fontan pathway pressure − mean atrial pressure

Importantly, the fenestration gradient is not a direct measurement of Fontan pressure. It represents the pressure difference between the Fontan pathway and the common atrium.

For example, if the mean fenestration gradient is 4 mmHg and the mean atrial pressure is 8 mmHg, the corresponding mean Fontan pathway pressure would be approximately 12 mmHg, assuming the Doppler and invasive measurements are obtained under comparable hemodynamic conditions.

This distinction is particularly important during intraoperative TEE because the same fenestration gradient can occur at very different absolute Fontan and atrial pressures. Therefore, the mean fenestration gradient should be interpreted in conjunction with atrial pressure and the patient's overall hemodynamic state.

Question 5

What factors can alter the Doppler-derived gradient across a Fontan fenestration during anesthesia?

Answer

The mean Fontan fenestration gradient is dynamic and should be interpreted in the context of the patient's hemodynamic and ventilatory conditions. Because the gradient reflects the pressure difference between the Fontan pathway and the common atrium, changes in pressure on either side of the fenestration can alter the measured gradient.

Factors that may alter the measured gradient include:

  1. Fontan pathway pressure
  2. Atrial pressure and ventricular filling pressure
  3. Pulmonary vascular resistance
  4. Intravascular volume and ventricular preload
  5. Ventricular systolic and diastolic function
  6. Atrioventricular valve regurgitation
  7. Positive-pressure ventilation including PEEP and mean airway pressure
  8. Hypoxemia, hypercarbia, and acidosis
  9. Fenestration size and geometry


A change in the measured gradient therefore does not necessarily indicate an anatomic change in the fenestration. For example, an increase in atrial pressure may reduce the fenestration gradient even when Fontan pathway pressure remains elevated. Conversely, an increase in Fontan pathway pressure relative to atrial pressure may increase the mean fenestration gradient.

Question 6

What are the important limitations and potential pitfalls when interpreting the Fontan fenestration gradient by TEE?

Answer

Several limitations should be considered.

  1. Doppler alignment
    Because velocity is angle dependent, failure to align the Doppler beam parallel to fenestration flow can underestimate velocity and therefore underestimate the calculated gradient.
  2. Peak versus mean gradient
    Because flow through the Fontan circuit is nonpulsatile/low-velocity and the relevant hemodynamic quantity is a sustained chamber-to-chamber pressure difference, the mean gradient over the cardiac/respiratory cycle best approximates that pressure difference rather than an instantaneous peak
  3. Loading conditions
    The gradient can change substantially with alterations in intravascular volume, venous capacitance, ventricular filling pressure, pulmonary vascular resistance, and vasoactive therapy.
  4. Mechanical ventilation
    Positive-pressure ventilation alters intrathoracic pressure, systemic venous return, pulmonary blood flow, and atrial pressure. The gradient obtained during general anesthesia may therefore differ from measurements obtained during spontaneous ventilation or cardiac catheterization.
  5. Fenestration anatomy
    A small or restrictive fenestration may generate a relatively high velocity and gradient, whereas a larger fenestration may permit substantial right-to-left shunting despite a relatively low gradient.

Therefore, fenestration gradient should be interpreted alongside ventricular function, AV valve regurgitation, Fontan pathway flow, pulmonary venous return, respiratory conditions, systemic oxygen saturation, and available invasive hemodynamic data.

Discussion:

The Fontan fenestration as a hemodynamic “Pop-Off”

The Fontan circulation separates the systemic and pulmonary circulations without a subpulmonary ventricle. Pulmonary blood flow is therefore dependent on the pressure gradient between the systemic venous pathway and the common atrium and is strongly influenced by pulmonary vascular resistance and ventricular filling pressure.

Creation of a fenestration establishes a communication between the Fontan pathway and the common atrium. Right-to-left flow through the fenestration can decompress the Fontan pathway and augment ventricular preload and cardiac output, at the expense of systemic arterial oxygen desaturation.

What does the fenestration gradient tell us?

An important teaching point is that the Doppler-derived mean fenestration gradient is not equivalent to Fontan pressure. Rather, when flow is directed from the Fontan pathway toward the common atrium, the mean gradient reflects the pressure difference between these two compartments:

Mean fenestration gradient ≈ mean Fontan pathway pressure − mean atrial pressure

Consequently, identical fenestration gradients may occur in very different hemodynamic states. For example:

Mean Fontan pressure

Mean atrial pressure

Mean fenestration gradient

12 mmHg

7 mmHg

5 mmHg

17 mmHg

12 mmHg

5 mmHg

22 mmHg

17 mmHg

5 mmHg

Thus, a low fenestration gradient does not necessarily indicate normal Fontan pressure or favorable Fontan hemodynamics. A low gradient may reflect a low Fontan pressure, an elevated atrial pressure, or a combination of the two. Conversely, a higher mean gradient reflects a greater pressure difference between the Fontan pathway and the atrium but does not, in isolation, establish the absolute Fontan pressure.

TEE Assessment

A comprehensive intraoperative TEE examination in a patient with Fontan circulation should evaluate:

  • Fontan pathway anatomy and flow (branch pulmonary arteries and Glenn anastomosis cannot be assessed with a TEE and typically require a transthoracic echocardiogram or an epicardial echocardiogram depending on the context)
  • Fenestration patency and direction of flow
  • Spectral Doppler assessment of the fenestration and mean fenestration gradient, when adequate Doppler alignment is possible
  • Pulmonary venous return
  • Atrial communication
  • Atrioventricular valve regurgitation
  • Ventricular systolic function
  • Semilunar valve function
  • Intracardiac thrombus or presence of thrombus in the Fontan pathway
  • Relevant residual or associated lesions


The fenestration Doppler signal should be interpreted as part of this broader assessment rather than as an isolated measurement.

Intraoperative Relevance

For the cardiac anesthesiologist, the value of the mean fenestration gradient lies less in defining a single “normal” cutoff and more in understanding the pressure relationship between the Fontan pathway and the atrium under the patient’s current physiologic conditions.

The gradient may change following induction of anesthesia, initiation of positive-pressure ventilation, changes in PEEP, volume administration, or vasoactive therapy because these interventions can alter Fontan pathway pressure, pulmonary blood flow, ventricular filling, and atrial pressure. When TEE is used intraoperatively in cases similar to that of the vignette provided, serial assessment may provide additional information regarding ventricular filling and volume status and can assess Fontan pathway patency during procedures in which positioning or anatomic changes could potentially affect conduit geometry.

The mean fenestration gradient is best interpreted as one component of an integrated hemodynamic assessment rather than as a surrogate for absolute Fontan pressure.


References

  1. Sanders EN, Chen JZ, Nissen T, Daily J, Zakaria D, Dalby S, Bolin E. Comparison of Echocardiographically-Calculated Fontan Fenestration Gradient and Catheter-Based Measurement. Pediatr Cardiol. 2025 Oct;46(7):2047-2053. PMID: 39395055.
  2. Buber J, Schwaegler RG, Mazor Dray E. Echocardiographic evaluation of univentricular physiology and cavopulmonary shunts. Echocardiography. 2019 Jul;36(7):1381-1390. PMID: 31246324.
  3. Gewillig M, Mertens LL. Echocardiographic Assessment of Functional Single Ventricles after the Fontan Operation. In: Echocardiography in Pediatric and Congenital Heart Disease. 2021.
  4. Gewillig M, Brown SC, van de Bruaene A, Rychik J. Providing a framework of principles for conceptualising the Fontan circulation. Acta Paediatr. 2020 Apr;109(4):651-658. doi: 10.1111/apa.15098. Epub 2020 Jan 8. PMID: 31737940; PMCID: PMC7155129.